Mortgage approvals & house prices
MENU

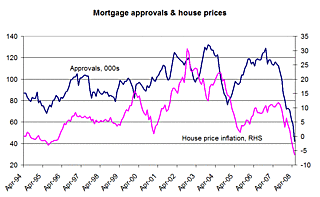
The Bank of England says mortgage approvals in May fell to their lowest level since their data began in 1993. This chart shows why this matters for house prices. It shows that mortgage approvals can be a lead indicator of annual house price inflation (on HBOSís measure). For example, dips in approvals in 2000 and 2004 led to falls in price inflation, whilst rises in approvals in 2002 and 2004 led to rises in inflation. Since April 1993, the correlation between approvals and price inflation in the following 12 months has been 0.42, with an R-squared of 23.5%. The regression equation is: Inflation = -14.01 + (22.97 x 100,000 approvals) If this equation continues to hold - and this is always a big if when one variable is at a record low - it points to prices falling 4.4% between now and May 2009. This doesnít seem too dramatic, given that prices have dropped 6.4% in the last 12 months. However, this would leave prices more than 10% below their peak. And the standard error in this equation is 6.3 percentage points, so current approvals are quite consistent with prices dropping 10% by May 2009. And this equation implies that approvals would have to rise to over 60,000 for prices to stabilize. Thatís a 40% rise from current levels. Good job housing isnít net wealth, isnít it?
